Attenuation versus Extinction
Note
All extinction curves are attenuation curves, but not all attenuation curves are extinction curves.
Attenuation
Interstellar dust absorbs and scatters photons re-emitting the majority of the absorbed energy in the infrared. Dust attenuation refers to the general impact of dust absorption and scattering on the spectrum of an object due to the presence of dust. Attenuation does not include the impact of the dust re-emission on an object’s spectrum. In general, the term attenuation is used to indicate that the geometry of the sources and dust in a system is more complex than a single star with a foreground screen of dust. In this simple case, the effects of foreground dust on a single star are termed extinction to distinguish it from the more complex geometrical cases. Examples of such complex geometries exhibiting attenuation include dusty galaxies (composed of many stars) and stars with circumstellar dust.
Measuring attenuation for an object is nominally as straightforward as measuring extinction. The spectrum of the object with dust is compared to an equivalent object with no dust. In reality, this is quite hard as the usual objects for such work are galaxies and no two galaxies are similar enough. This can and has been done for samples of galaxies (e.g., starbursts: Calzetti et al. 1994, 2000; local galaxies: Wild et al. 2011, Battisti et al. 2016, 2017; & distant galaxies: Reddy et al. 2015.) or by using a model for the stellar populations and attenuation shape in that galaxy (e.g., Conroy 2010; Buat et al., 2011, 2012, 2018; Kriek & Conroy, 2013; Salmon et al., 2016).
Theoretically calculating the attenuation curves can be done using dust radiative transfer models. As a result, the effects of multiple sources and scattering into the observed beam are sometimes referred to as radiative transfer effects. Such radiative transfer calculations require specifying the geometry of the photon emitters (stars) and dust grains as well as the grain details (size, shape, composition).
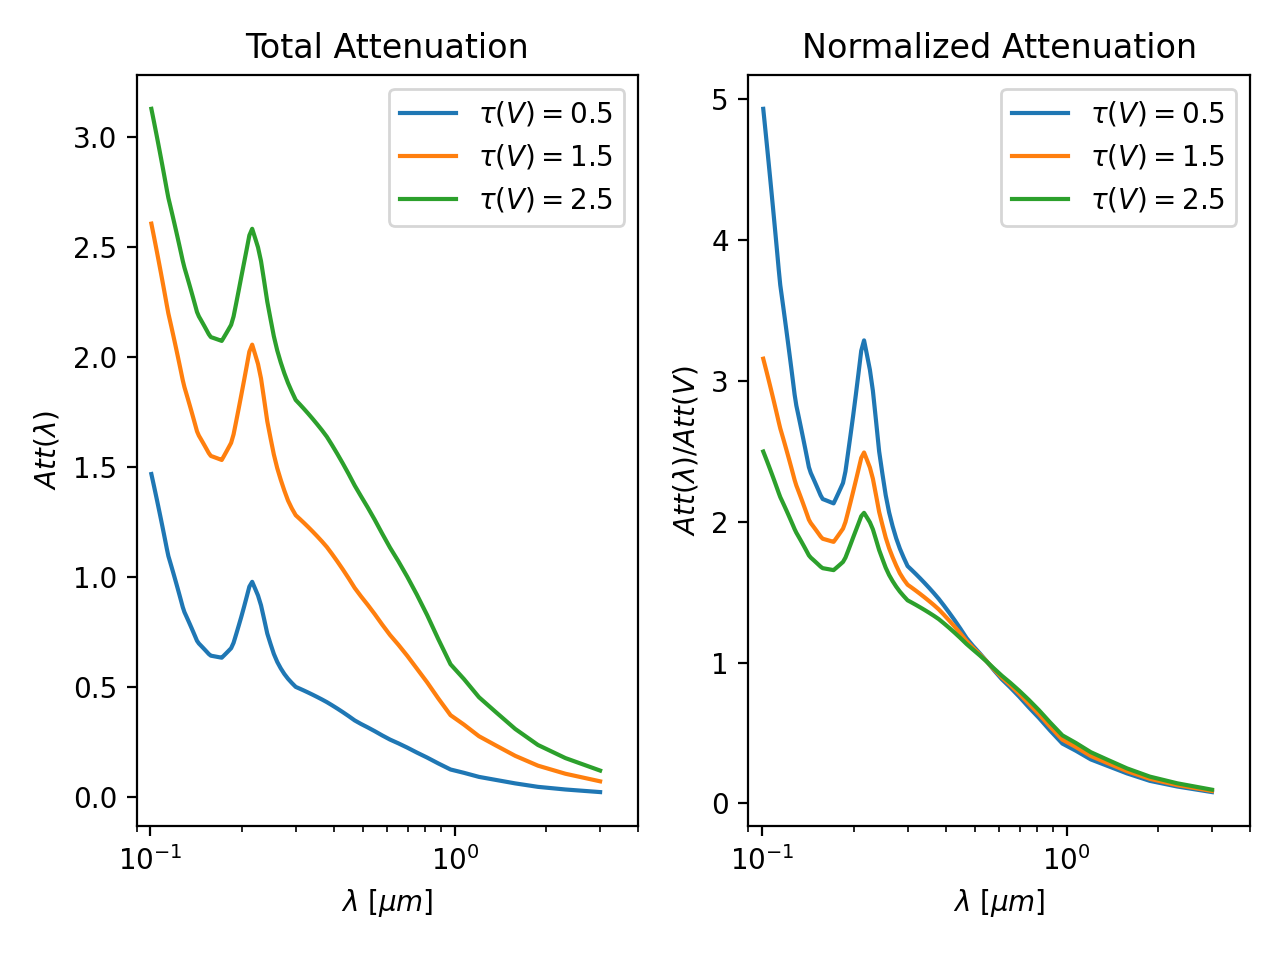
Attenuation includes the effects of having multiple sources extinguished by different columns of dust and the scattering of photons into the observation beam. Unlike extinction, these two effects mean that the attenuation is not directly proportional to the amount of dust in the system. Hence the ratio of attenuations at two different wavelengths varies with the amount total system dust. In other words, the shape of the attenuation curve varies with the total amount of dust in the system unlike the case for extinction. This is illustrated below with “WG00” shell, clumpy, mw models, where the left plot shows the total attenuation as a function of wavelength and the right plot shows the same curves normalized by Att(V).
(Source code, png, hires.png, pdf)

The impact of the two radiative transfer effects can be illustrated using one of the simple systems composed of a slab of dust with uniform dust density and two stars embedded to varying depths. These calculations used the DIRTY radiative transfer model (Gordon et al. 2001; Misselt et al. 2001) and a variant of the TRUST slab benchmark geometry (Gordon et al. 2017). There are 4 different geometrical model variants, with the only change being the location of the 1st star in the slab varying from on the surface nearest the observer to half way through the slab. The 2nd star is always located at the back of the slab as seen by the observer. The V band optical depth is 2 along the line-of-sight from the observer to star 2. The geometry of these 4 model variants is illustrated in the lower, left panel of the figure below.
The upper, left panel in the plot illustrates the impact of varying the extinction towards star 1 while keeping the extinction to star 2 fixed. The normalized attenuation curves change shape drastically, even through the normalized extinction curve towards both stars is identical. This is the impact of having multiple sources in a system, each seen through a different dust column and this is the 1st radiative transfer effect. The upper, right panel gives the attenuation curves for the same models, but now including the contribution from scattered photons into the observer’s line-of-sight - the 2nd radiative transfer effect. The lower, right panel gives the fraction of the total flux from the system due to this scattered flux. The wavelength where the scattered flux peaks is a combination of the total optical depth of the system and the impact of multiple scatterings. Note that the total attenuation as measured in the V band is always less when the contribution from scattered flux into the observer’s line-of-sight is included (numbers given in the legends).

Over the past 2 decades, radiative transfer simulations have been used to understand the radiative effects in different dust-star geometries (e.g., Witt et al. 2000, Pierini et al. 2004, Tuffs et al. 2004, Seon & Draine 2016). Recently, Law et al. 2018 made publicly available a grid of galaxy SEDs from the UV to IR/sub-mm where a stellar population synthesis model responsible for the stellar & gas photons is connected to the IR emission through dust grain physics using the DIRTY radiative transfer model.
References
Battisti et al. 2016, ApJ, 818, 13
Battisti et al. 2017, ApJ, 840, 109
Buat et al. 2011, A&A, 533, A93
Buat et al. 2012, A&A, 545, A141
Buat et al. 2018, A&A, arXiv:1809.00161
Calzetti et al. 1994, ApJ, 429, 582
Calzetti et al. 2000, ApJ, 533, 682
Conroy 2010, MNRAS, 404, 247
Gordon et al. 2001, ApJ, 551, 269
Gordon et al. 2017, ApJ, 551, 277
Kriek & Conroy 2013, ApJL, 775, L16
Misselt et al. 2001, A&A, 603, A114
Law et al. 2018, ApJS, 236, 32
Pierini et al. 2004, ApJ, 617, 1022
Reddy et al. 2015, ApJ, 806, 259
Salim et al. 2018, ApJ, 859, 11
Salmon et al. 2016, ApJ, 827, 20
Seon & Draine 2016, ApJ, 833, 201
Tuffs et al. 2004, A&A, 419, 821
Viaene et al. 2017, A&A, 599, A64
Wild et al. 2011, MNRAS, 417, 1760
Witt & Gordon 2000, ApJ, 528, 799
Extinction
Interstellar dust extinction is the result of photons being absorbed or scattered out of the line-of-sight by dust grains. Extinction is explicitly linked to the specific geometry of a single star observed through a column of dust.
Both dust absorption and scattering out of the line-of-sight are processes that are directly proportional to the amount of dust along the line-of-sight. As a result, the ratio of dust extinctions at two different wavelengths does not vary with different amounts of dust, i.e., the shape of the extinction curve is independent of the amount of dust in the system. This makes the measurement and/or theoretical calculation of extinction much simpler than the more general case of attenuation.
The separate package dust_extinction package exists to provide extinction models.